


(CFBDm) Model v2 + Week 5
We have moved the model to a "version 2" with some fairly significant updates after a near .500 performance from v1. We'll continue to track progress and find where we can target.

If you are new here, we have decided to “build a winning model” together. It’s important to understand right from the jump that this is a work-in-progress and we’ll make data-driven decisions to help get this thing to 55% consistently. That will take some time, as we know. The first version of the model was doing great before sliding back to mediocrity and eventually into a loser. So, why the change already? Let’s discuss…
|||||| PLAYER RATINGS UPDATE
Our depth charts feed everything that we do here. We keep up with every injury, every trend in playing time and anything else that may impact a team on the field. A very important aspect of that system is having player ratings that keep up with the most recent performance. We realized that the team ratings and subsequent rankings were not quite keeping up with what we are seeing on the field. So, we made a change to adjust the weight of this seasons’ performance at a good clip heavier. We saw a quick impact. Now, we are not ignoring past results and performance at the player-level. We need that. AND…we are definitely not taking past results as gospel here. The goal of this Model is to be data-driven and forward looking.
|||||| TRENCH IMPACTS
Another lesson learned from the first version is that we saw the lower portion of the FBS “hanging” with the upper-eschelon a bit too much. The discrepancy between Texas and ULM for instance, was at a 35-point difference. We are seeing that that spread should be closer to 50. Similarly, Kent State was projected to cover against both Tennessee and Penn State in back to back weeks, each time getting 49 (!) points. They didn’t cover either, and the Tennessee one wasn’t even close.
Instead of changing the calculations of the algorithm across-the-board, we thought it would be wise to kill two birds with one stone and add in our “trench difference” metric in order to better separate the great from the really, really bad. It can also serve as a differentiator between two evenly-matched squads. So, we put the offensive line up against the front seven talent and incorporated major differences in talent-level as an impact to the simulation.
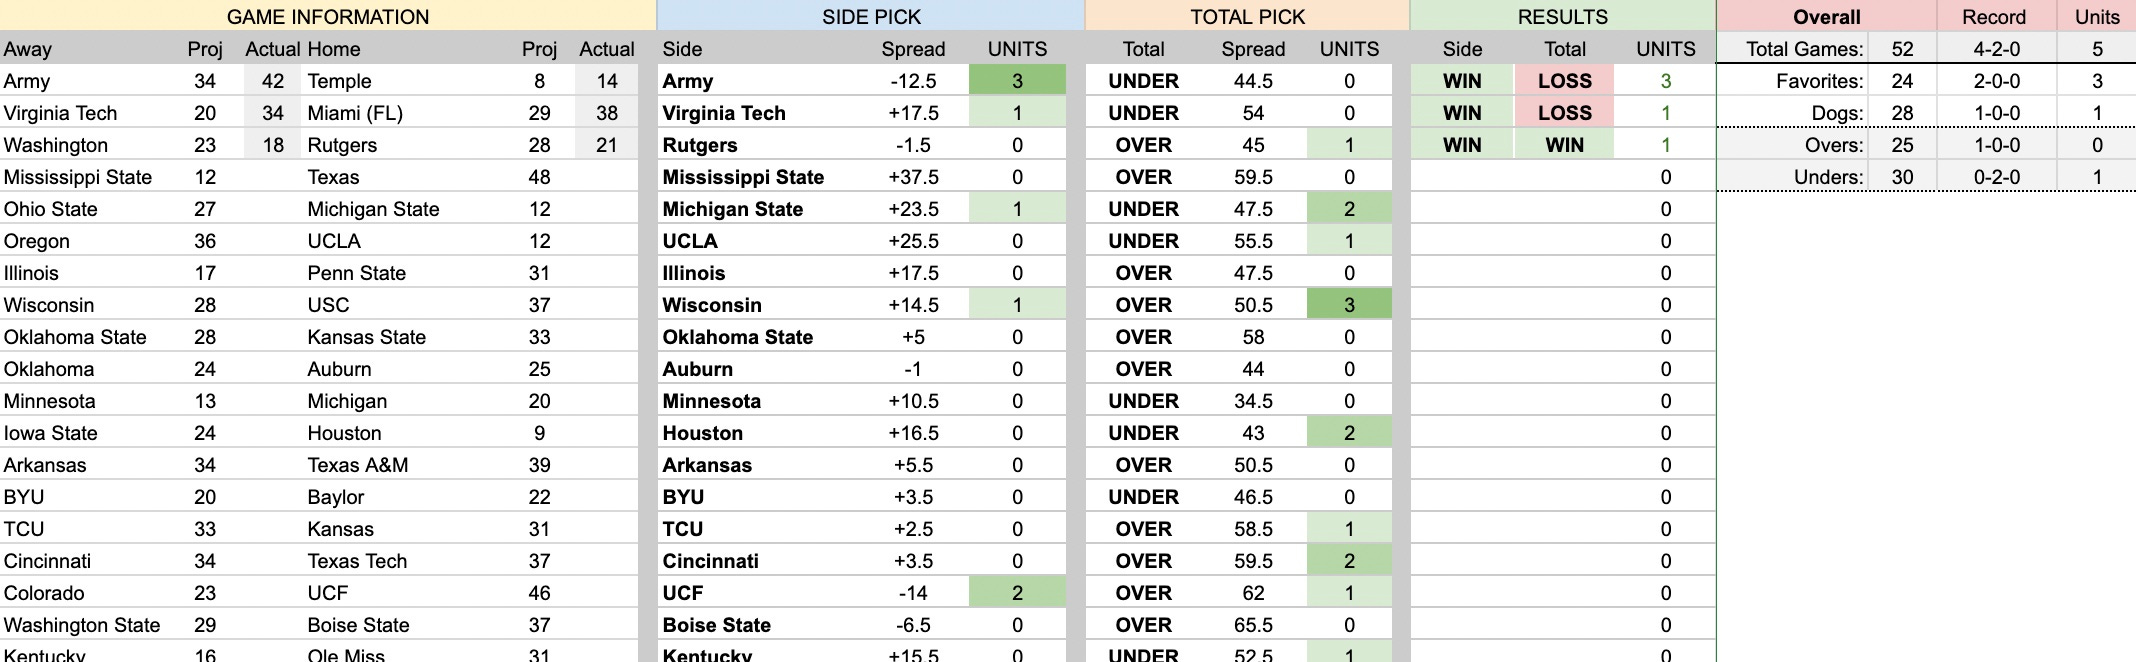
ARMY EXAMPLE ::: We are immediately seeing returns more in line with what we are anticipating. The first test was Thursday night when Army’s offensive line (ranked 1st in run blocking) took on Temple’s 115th ranked front seven. Before the trench aspect was added; this was very close to the final 12.5 line. After it, Army pulled away, leading to a 3-UNIT play and if you watched the game; it wasn’t even close.
|||||| WEEK FIVE SATURDAY MODEL SIMULATIONS
Do we think this is perfect now? Nope. Likely never will be. But, it is improved. Another change is that we’ll provide you with EVERY game we are projected (FBS vs. FBS only) in a spreadsheet so that you can consume what the Model is projecting and make your own decisions. We will go a little more in-depth on the over 2-UNIT plays here and then get you the link to the full spreadsheet (updated with results as they come in) below…
3-UNIT PLAYS ::: We had Army as a 3-UNIT play on Thursday (hit). We’ll see if these others can come through for us:
Wisconsin at USC - OVER 50.5
This is surprising to be honest. Wisconsin’s offense has been dismal at BEST this year and now they don’t have their starting quarterback in Tyler Van Dyke. What gives? Well, the key is that both offenses are running fast. Both are over 70 plays/per game and that’s feeding a potential back-and-forth. This is actually going to be a good measuring stick for the “pace” factor in our algorithm. It may be weighted a little too much. We’ll keep an eye on it.
Navy (-4.5) at UAB
We love our troops. Not just for the obvious reasons, but because they have been cover machines for us early on. This certainly has to do with the heavy run scheme for the Mids and a really not great run defense for the Blazers. The model sees Navy taking full advantage of this and running it up on the road.
Old Dominion at Bowling Green - UNDER 51
Again, this is a pace thing. Both run slow and even though both also have 100+ ranked defenses as a whole, the offenses are nothing to write home about.
Air Force (-4) at Wyoming
Another service academy! And, it’s not like we really love what the Falcons are doing, but the Model really, really doesn’t like what it sees from Wyoming. Even with this one being in Laramie; it’s not enough to overcome a talent difference and some matchups that go Air Force’s way.
That’s it for the 3-UNIT plays. Here is a quick preview of what is in the link below
And, here is a link to the full week five spreadsheet for your viewing and tracking pleasure:
Keep reading with a 7-day free trial
Subscribe to CFBDepth’s Substack to keep reading this post and get 7 days of free access to the full post archives.