
Explained: Game Cards
This is a quick primer on how to best approach and understand our awesome, yet slightly intimidating "Game Cards" to it's highest potential.

Last year, we began publishing ‘Game Cards’ with the intent to pull in all of the information provided in our depth charts, ratings, rankings, and other insights throughout the site, into a document to help compare squads about to do battle.
Simple in premise — difficult in execution. The response has been well received, and to sum it up:
These ‘game cards’ are freaking awesome!
So, um, what am I looking at exactly?
-Paraphrased comments from just about everybody
We are here today to help guide you through what you see when you open one of these data-driven, compiled matchup cards…
The best advice we can give is to take it a section at a time. Breaking it down into the following categories:
General Game Information
Schedule/Results, Strength of Schedule and dWIN
Matchups / Breakdowns / Edges
Injury & Status Reports + Injury Impact Report
Trench Report
Model Prediction
Now, we’ll break down each of these sections in more detail to get you up to speed on everything included:
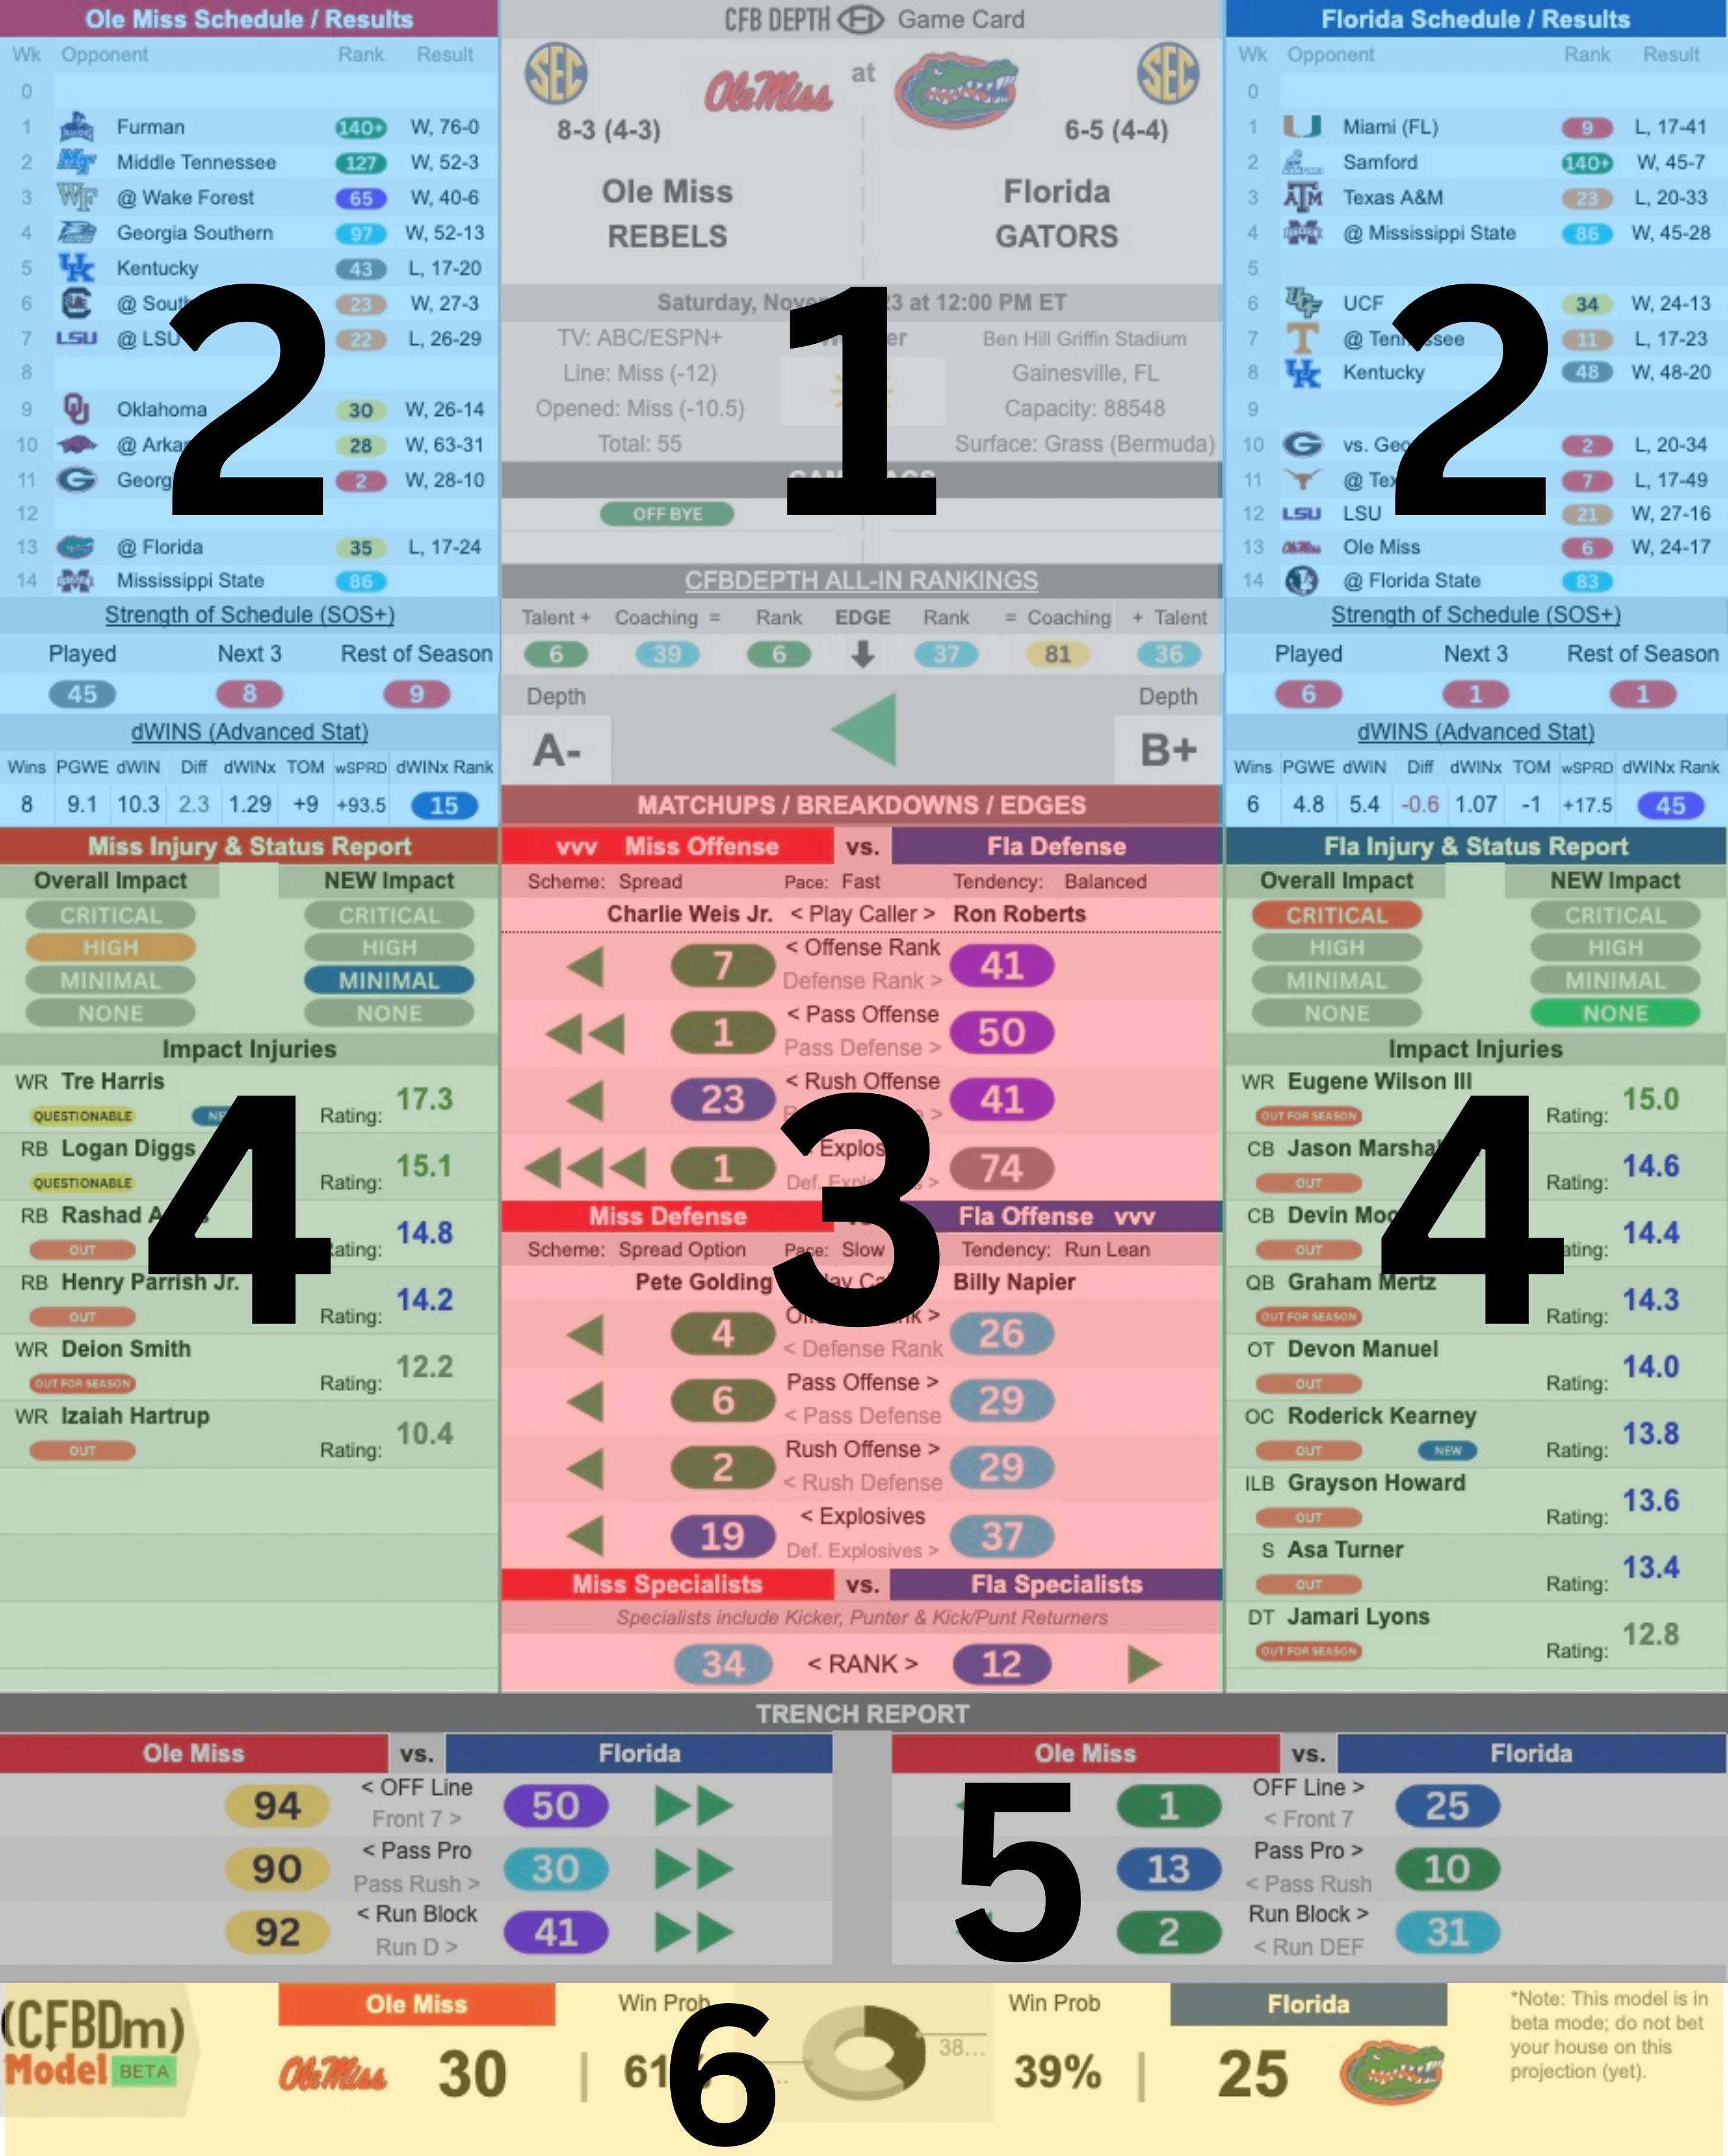
1. General Game Information
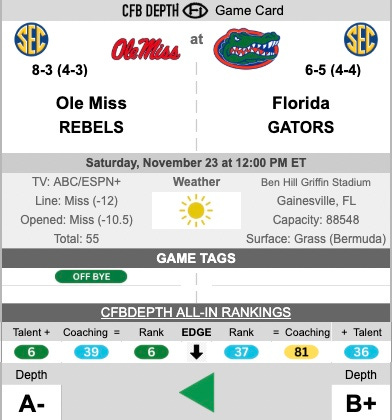
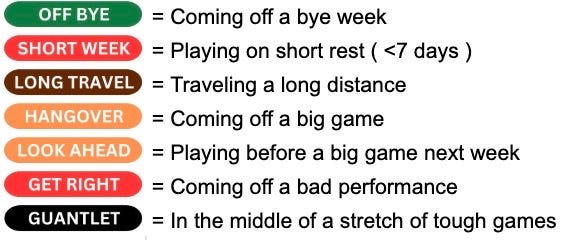
This section includes the date, time, location and current records for each team. It also includes where you can find it on TV, what the spread opened at in Vegas and what the current line and total (consensus) is at the time of publish. It includes the venue, city, state, capacity and field surface. The “Game Tags” could be any of the following that apply to this particular matchup:
The “All-In Rankings” include the pure rotational talent level of the entire roster, as well as coaching impacts and depth grade, to determine their ranking. The arrow indicates the direction of the advantage. The more arrows one way or another indicate the larger advantage/disadvantage.
2. Schedule/Results, Strength of Schedule and dWIN
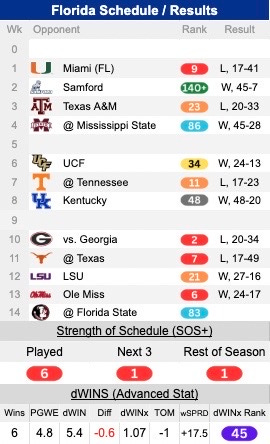
This section helps you understand the kind of schedule the team has faced this season and how many of their wins they have deserved. It’s a simple run down of all games, including their opponents’ ranking and the result. You can look for close games and/or winning/losing streaks to help tell the story. Compare that to their ‘strength of schedule’ for the season thus far and what remains.
Finally, the ‘deserved Wins’ metric is designed to show you at-a-glance how ‘deserved’ their win total is at this point. In this example, you’ll see that Florida has six wins on the season. They have a dWIN of 5.4 — meaning they have 0.6 wins more than they actually deserve. PGWE stands for “Post-Game Win Expectancy” and that adds up those totals throughout the season. That information is provided by collegefootballdata.com and the Gators have just a 4.8 metric there. TOM stands for turnover margin to get an idea of how the turnover luck has treated them this season and wSPRD is their total point-performance against the spread throughout the season.
3. Matchups / Breakdowns / Edges
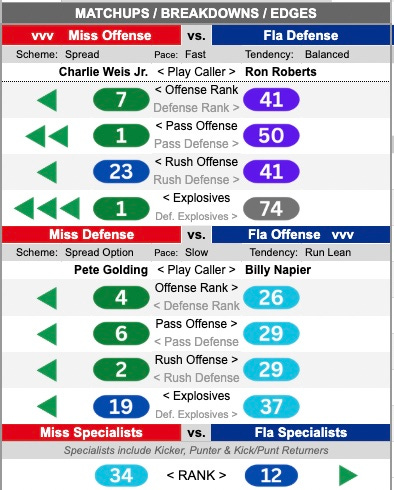
This middle section provides a glimpse of the rankings on each side of the ledger with the arrows (1-4) showing the level of advantage on each side. At quick glance, Ole Miss’ largest advantage is in their explosive play rate (ranked 1st in all of football), compared to the Gators’ ability to limit such plays.
The only advantage to be found in this particular matchup for Florida is in the cumulative “Specialists” ranking, which includes kicker, punter and kick returners.
This section also provides schemes and play-callers on both sides of the ball.
4. Injury & Status Reports + Injury Impact
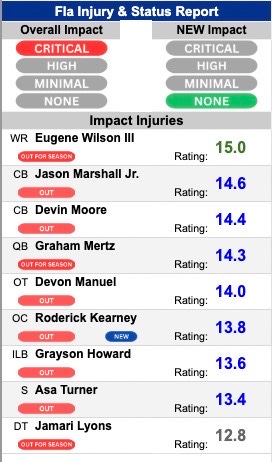
This section provides the nine most impactful injuries on a team, with player information, including position, injury/status, player rating (sorted highest to lowest) and a tag if the injury is “new” from the previous week.
The Impact Report at the top provides a look at the overall impact of the cumulative injuries on a team (in this case, Florida is very banged up and it’s rated a ‘critical’ impact). It also shows the impact of the ‘new’ injuries to help you determine if you can expect a drop in production due to a surge in new ailments.
5. Trench Report
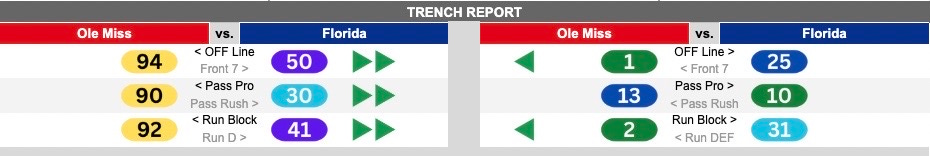
If you have followed us for a while now, we make no mistake that we believe college football games are won in the trenches. In the offensive and defensive lines. So, we break this out a bit further and show you any advantages we are seeing in the rotational talent on both sides of the ball (compared against each other).
We show one side’s Offensive Line as a whole (ranking), their pass protection ranking, and their run blocking rating. That’s put up against the opponents’ front seven (defensive line + linebackers), pass rush, and run defense rankings. You’ll see the green arrows to identify the advantages in the trenches quickly. As you can see in this example, the Gators actually have an advantage on the defensive side against Ole Miss’s offensive line. On the other side, it’s relatively evenly matched.
6. (CFBDm) Model Prediction
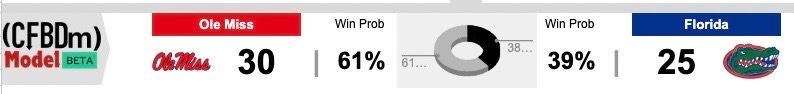
Finally, we provide you with what our Model simulation of the game looks like. We provide a final score and win probabilities on each side.
Game Cards also include rotational depth charts for offense, defense and specialists following this first page.
We hope this quick primer gives you a better understanding of our ‘Game Card’ set up and how to attack it. The purpose is to give you a better understanding of the matchup and help you make any decisions needed.
Thank you for following along and please help spread the word!