

Welcome CFBAI to the scene. So many AI Agents out there, but where is the one that I can go to that is dedicated to the great game of college football? Well, we just answered that.
We built this tool with a great team from SeeSaw Labs with the goal of providing a data-driven approach to whatever it is you want from your college football experience. From the hardcore, superfan to the casual observer, we don’t want to guess what you want to know, we want to provide you the answers to what you want to know.
We have loaded this Agent up with our data serving as the primary source of information. It’s then backed by other college football data sources and then leans on Claude/Anthropic to do those web searches that yield the best results possible.
So, what can I use this for?
We want the answer to this question to be: anything your college football-loving heart desires.
Like any AI Agent, it is certainly not perfect and developing your prompting skills will lead to the best results, but the data and information is there. Let’s uncover it.
In this article, we’re going to go through some use cases, from casual to hardcore. This will show you the depth (pun intended) of this tool.
If you are familiar with Claude’s research models, we utilize those:
Haiku = quicker answers; just looking for a fact or two
Sonnet = deeper research; will take more into account
Opus = deepest research; dynamic lookups and builds the most thoughtful response
Let’s keep those in mind as we go through this…
CASUAL PROMPT #1 (Haiku): Who is the starting left tackle for Oklahoma and is he any good?
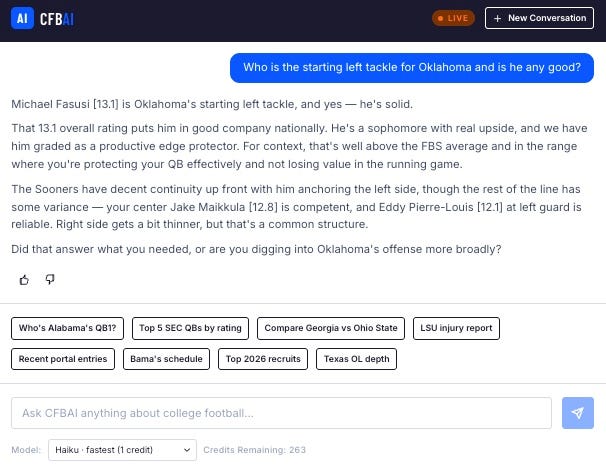
You can see the full answer in this image. Again, quick question. Quick answer. It also prompts you for what else you want to know.
FEATURE: What’s great about this is that it learns about you (as long as you are logged in and using your account). If you are a big OU fan and consistently ask questions about the Sooner and their opponents, the Agent will lean that way and build a profile deeper with that specific knowledge and be ready with answers.
If you are an avid gambler and ask about the best parlays each week, it will be prepared for that the more you engage. You can set preferences with it and even ask it what it knows about you. You can correct it, and or just become best friends.
CASUAL PROMPT #2 (Haiku): Who has a tougher schedule? Alabama or Georgia?
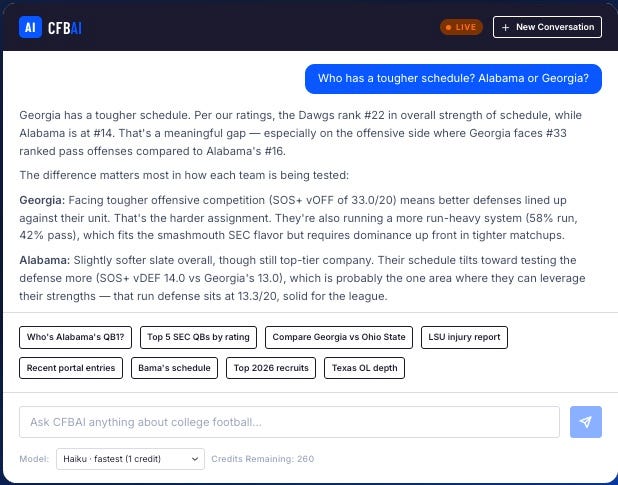
Just a little added context beyond the image from the Agent:
“The Dawgs’ offense is also loaded — they’ve got that elite passing attack (15.1/20 pass rating) and rushing unit (14.7/20) — but they’re going to earn every yard this year. That’s the trade-off with the harder road.”
ERROR — noticed an error here from the Agent. This is a teaching opportunity. It read the lower ranking in SOS+ as an easier schedule, not the other way around as it’s intended. So, I corrected it. Then, I started a new conversation and asked about two other teams to ensure it learned it’s lesson…
NEW CASUAL PROMPT #2 (corrected; Haiku): Who has a tougher schedule this year? Missouri or Oklahoma?
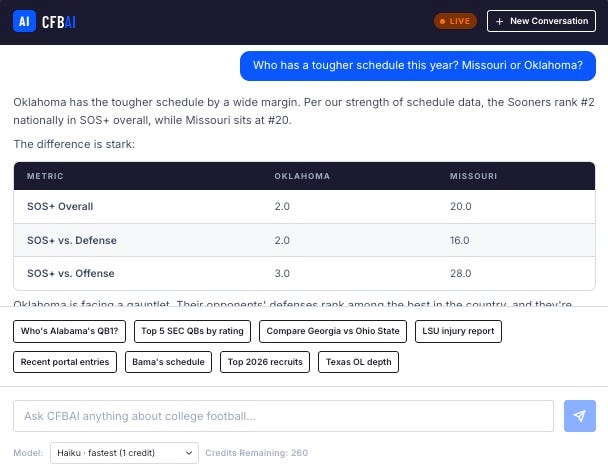
OK, it’s fixed. Here is some added context provided on the SOS+ rankings for the 2026 season (Mizzou vs. OU):
“Oklahoma is facing a gauntlet. Their opponents’ defenses rank among the best in the country, and they’re running into an incredibly tough slate defensively as well. Missouri’s schedule is substantially softer — especially on the offensive side (#28 vs. #3), meaning the Tigers are looking at an easier road against opposing defenses.
Both are SEC teams, but Oklahoma’s in a different universe on the SOS chart. If the Sooners stay relatively healthy and get wins in that meat grinder, it’s going to mean a lot more than a comparable record for Mizzou.”
Let’s move to some more advanced prompts…
ADVANCED PROMPT #1 (Sonnet): Please compare the Florida offensive line to the Tennessee defensive line and provide insights I should know.
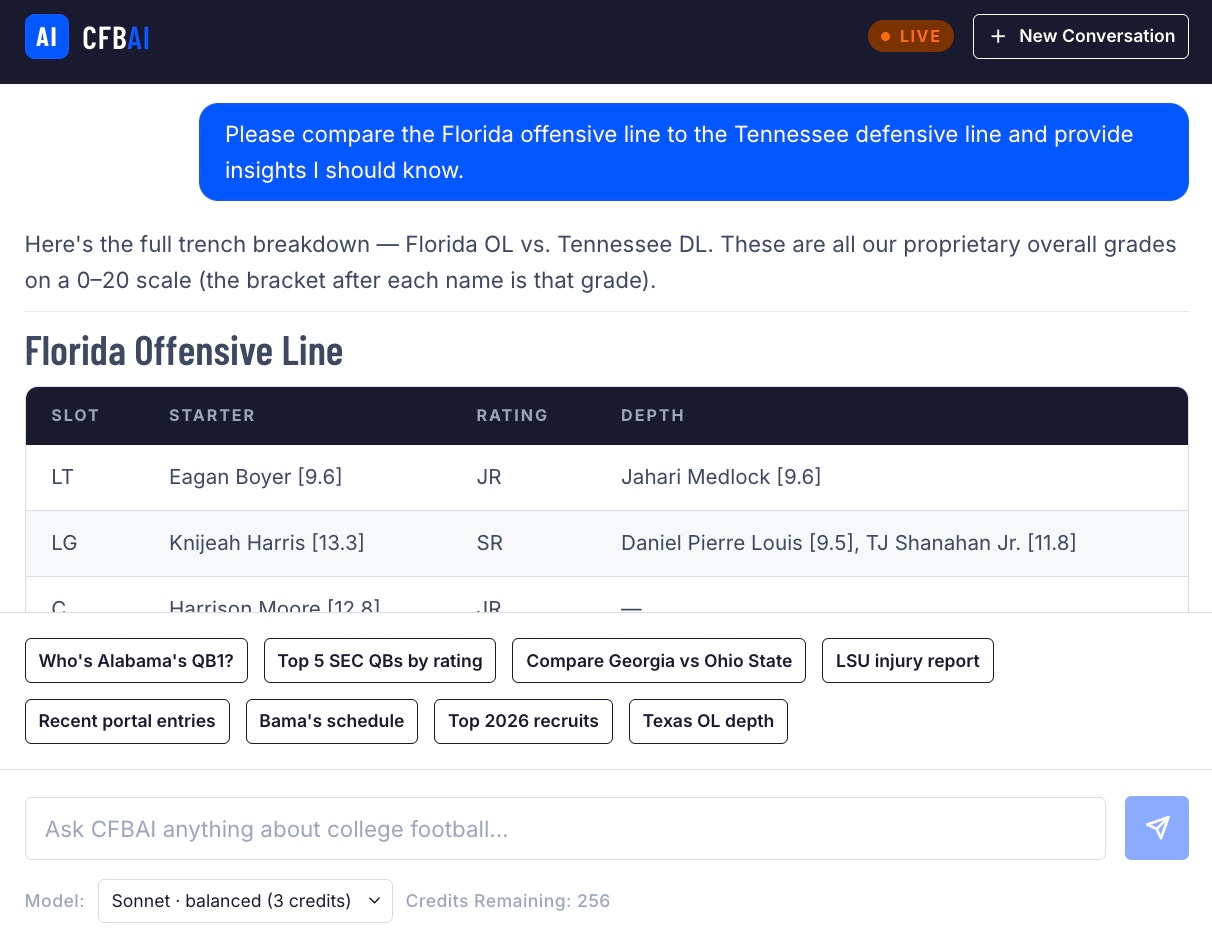
Here is the full response:
Key Insights:
1. Tennessee wins this matchup — and it isn’t particularly close.
The Vols’ top four on the defensive line average nearly 13.0/20, while Florida’s starters average closer to 11.9/20. That’s a meaningful gap at a position where a half-point difference can swing a game, let alone a full point.
2. Florida’s interior is the strength — the edges are the problem.
Knijeah Harris [13.3] at LG, Bryce Lovett [12.9] at RG, and Harrison Moore [12.8] at center form a respectable interior. That’s legitimately good. But both tackles are a significant drop-off — Eagan Boyer [9.6] at LT and Caden Jones [10.9] at RT are well below the level of the interior group. That’s where Tennessee will hunt.
3. Tennessee has the depth to rotate and keep the juice up.
Mariyon Dye [13.4] and Tyree Weathersby [13.4] are the headliners, but the Vols go seven or eight deep with players rated 12.3/20 or better. They can sub freely and not lose much. Florida does not have that luxury on the back end — when they lose a starter, they’re sliding guys rated in the 9s into the lineup.
4. The LT situation is worth watching closely.
Boyer at 9.6/20 protecting Florida’s blindside against a Tennessee DL that can put up three or four quality rushers simultaneously? That’s a matchup the Vols should be licking their chops over. If the Gators’ QB takes early heat off the edge, the whole offensive rhythm can get disrupted.
5. Tennessee’s sophomore DL pieces are intriguing long-term.
Mariyon Dye [13.4] and Isaiah Campbell [12.6] are both second-year guys posting starter-caliber grades. This unit isn’t just good now — it’s built to stay good.
Bottom line: Florida’s interior can compete, but Tennessee has the edge, the depth, and a specific target on the Gators’ tackle spots. If Florida wants to keep their QB upright, the run game may need to carry early to keep the Vol pass rush honest.
As you can see, this is a more in-depth response from the Sonnet model and includes insights that help determine who holds the edge.
ADVANCED PROMPT #2 (Sonnet): Which SEC teams have the most impactful injuries right now?
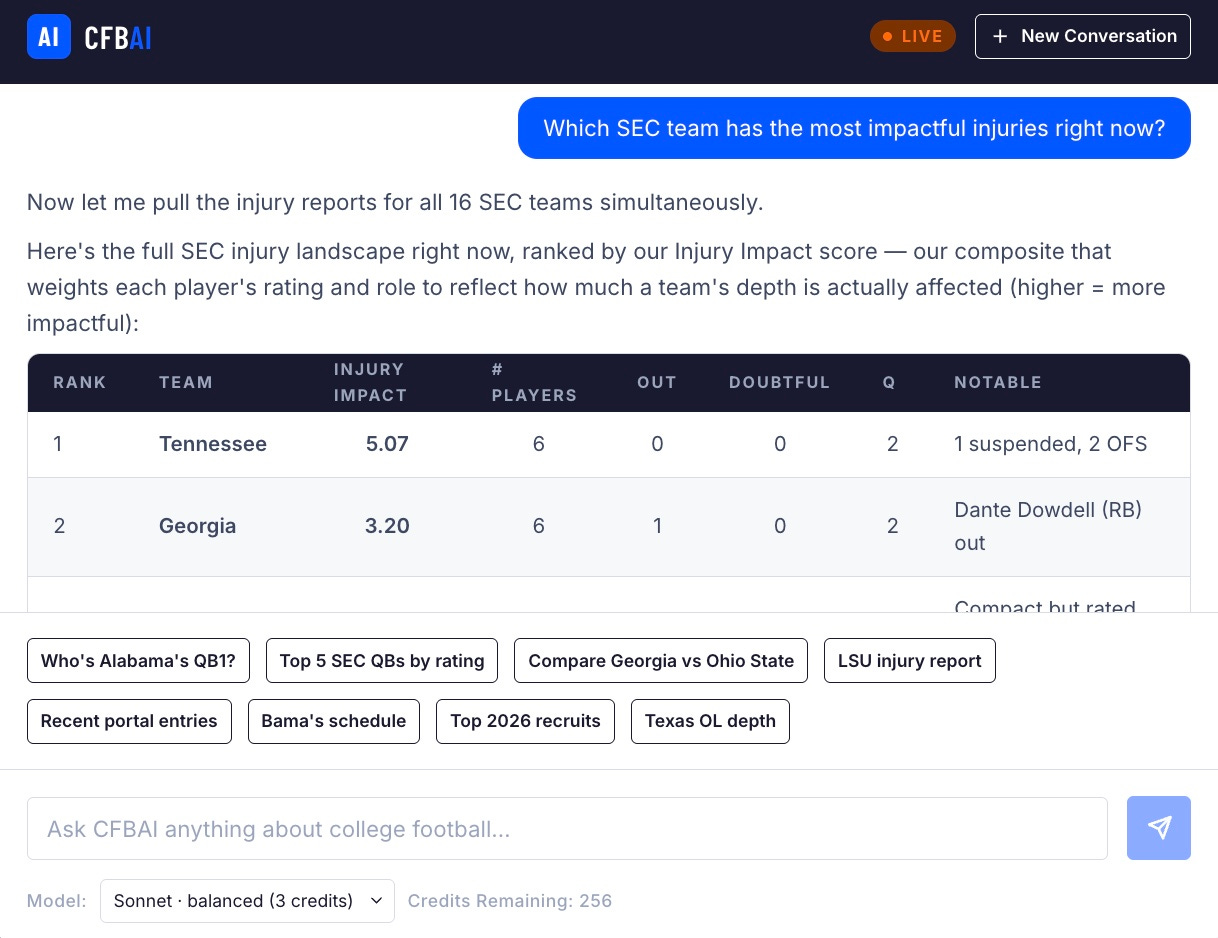
This response gives a full rolled up picture of the SEC injury status and some insights at the end. After the full table, here is the response:
Tennessee leads the SEC in injury impact heading into the 2026 season. Their composite of 5.07 is nearly double Georgia’s 3.20 — and it’s driven by quality, not just quantity. Six players affected, including LB Arion Carter (suspended), and two more listed as OFS (out for the season). That’s a lot of depth chart disruption in the front seven and secondary before a single game is kicked.
Georgia is second and the more concerning story from a pure talent standpoint — RB Dante Dowdell is listed as out, and they’ve got a couple of defenders questionable. The Dawgs have enough depth to absorb it, but it’s worth watching as fall camp progresses.
Alabama is third despite only three players on the report — that’s a testament to the caliber of the players involved. Fewer bodies, bigger ratings, higher composite.
Florida is the volume leader with six questionable players and zero out or doubtful — basically a “wait and see” situation, but all of those Q’s could flip in either direction quickly.
Now, let’s really test this thing. Move to Opus. Let’s challenge it to simulate a week zero game coming up. As we up the level, we need to up our prompt game, so let’s iterate a bit here. We’ll use the first prompt to show what our general model would come up with and then we’ll tweak to some different specifications…
We will use the week zero matchup between North Carolina and TCU as our example for this part.
SICKO PROMPT #1 (Opus): Please simulate the week zero North Carolina at TCU game. Include a final score, and any key player statistics based on your player volume projections. Provide a game script to go along with this.
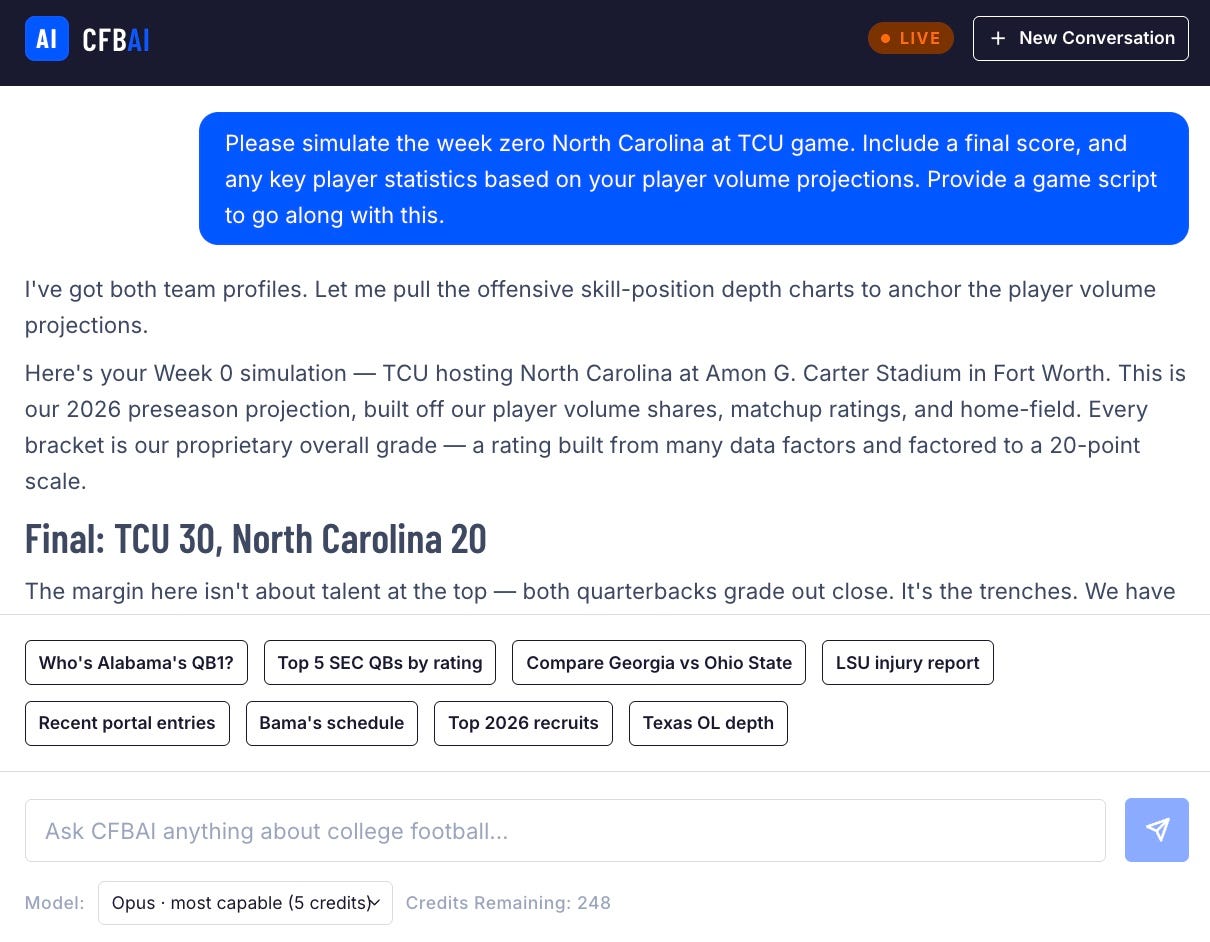
OK, so the Horned Frogs win this one by ten. But, it’s what goes into this projection that makes this special and unique:
The margin here isn’t about talent at the top — both quarterbacks grade out close. It’s the trenches. We have TCU’s offensive line at 12.7 with run blocking at 13.2/20, against a UNC front we grade at 11.7/20 pass rush and a run defense at 12.0/20. Flip it around, and Carolina’s line is the softer unit — 10.9 O-line, 10.7/20 run blocking — trying to hold up against a TCU 4-2-5 that generates a healthier pressure rate (13.4% vs. UNC’s 10.8%). Home-field (we give the Frogs +2.5 here) tips a one-score projection into a two-score one.
Key player projections (volume-based)
TCU — Horned Frogs
PlayerProj. LineQB Jaden Craig [13.9]22/32, 268 yds, 2 TD, 0 INT; 6 car, 34 ydsRB Jeremy Payne [14.4]19 car, 104 yds, 1 TD; 3 rec, 22 ydsWR Jordan Dwyer [13.6]7 rec, 96 yds, 1 TDTE Lafayette Kaiuway [13.5]4 rec, 41 ydsWR Major Everhart [12.3]4 rec, 38 yds
North Carolina — Tar Heels
PlayerProj. LineQB Billy Edwards Jr. [14.3]24/38, 251 yds, 1 TD, 1 INT; 5 car, 19 ydsRB Demon June [12.7]13 car, 61 yds, 1 TDRB Benjamin Hall [12.4]10 car, 44 ydsTE Jelani Thurman [14.9]6 rec, 68 yds, 1 TDWR Jordan Shipp [14.1]6 rec, 74 yds
Jelani Thurman [14.9] is Carolina’s highest-graded skill player and the security blanket for a Belichick-Petrino offense breaking in a new system — expect Edwards to lean on him early and often. TCU counters with the best back on the field in Jeremy Payne [14.4], and that’s the game within the game.
Game script
1st quarter — Feeling-out period, and it stays low. TCU’s opening drive stalls in the red zone; they settle for a field goal behind the Payne ground game. Carolina answers with a Thurman seam route to flip field position, but the drive dies on a 3rd-and-medium when the TCU front wins up front. TCU 3, UNC 0.
2nd quarter — The Frogs start hitting the intermediate stuff. Craig-to-Dwyer for a chunk gets them into scoring range, and Payne punches it in. Carolina responds right before half — Edwards is efficient on the two-minute drill and finds Shipp, then June finishes on the ground. TCU 17, UNC 10 at the half.
3rd quarter — The margin the trenches were always going to create. TCU controls the clock with Payne, and a sustained drive ends in a Kaiuway score off play-action. UNC’s offense gets bogged down as the pass rush starts collapsing the pocket — a Craig-side turnover-worthy moment gets erased, but Carolina’s own drive ends in an interception. TCU 24, UNC 10.
4th quarter — Carolina makes it a game late. Thurman hauls in a red-zone touchdown to cut it to a one-score margin with time to work. But TCU salts it away on the ground — Payne and the O-line bleed the clock, and a closing field goal restores the two-score cushion. Carolina gets one last possession that ends on downs. Final: TCU 30, UNC 20.
My read: the number I’d trust most in this whole projection is the line-of-scrimmage edge. If Carolina’s front — especially at left tackle, where we’ve got Jordan Hall [11.0] as the thin spot — can’t slow TCU’s pass rush, the Tar Heels are chasing all night. The one variable that flips it: Edwards is a legit 14.3, and if Petrino schemes Thurman and Shipp open early, a Carolina fast start rewrites the whole second half.
Want me to run a version with a different pace or a specific injury scenario baked in? The projection moves fast when playing time shifts.
Let’s iterate. I want it to re-run this simulation with more of a weight on the trenches. Let’s see if that changes things…
SICKO RE-PROMPT #1 (Opus): Okay, very nice. So, now I’d like you to re-run this simulation with a heavier (25% more weight) on the trenches. I feel that it is often under appreciated in general models, so in this particular match-up, would anything change if that were the case. Also, I want to run this simulation without Billy Edwards Jr. starting for North Carolina. How does that impact this game?
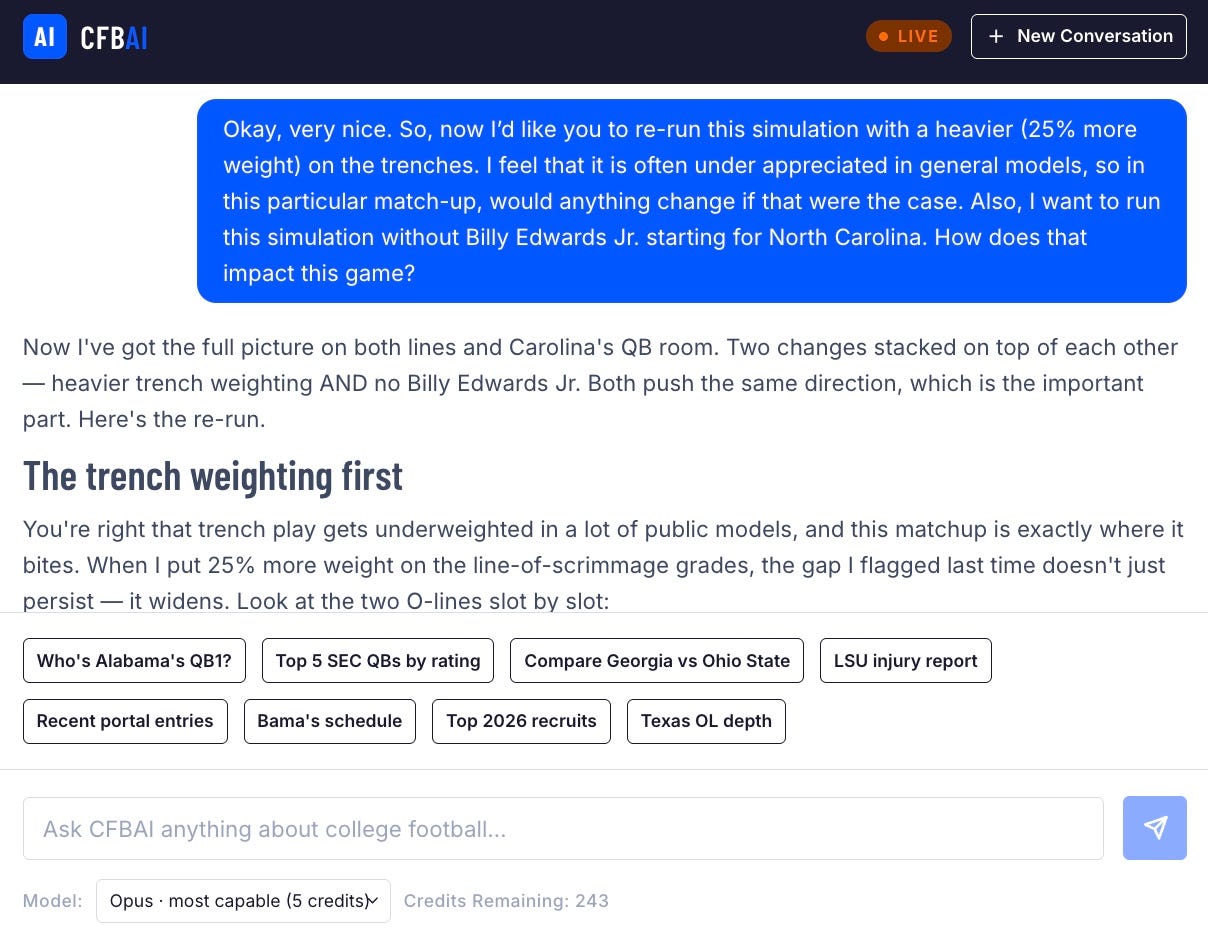
Let’s see how it handles this:
Now I’ve got the full picture on both lines and Carolina’s QB room. Two changes stacked on top of each other — heavier trench weighting AND no Billy Edwards Jr. Both push the same direction, which is the important part. Here’s the re-run.
The trench weighting first
You’re right that trench play gets underweighted in a lot of public models, and this matchup is exactly where it bites. When I put 25% more weight on the line-of-scrimmage grades, the gap I flagged last time doesn’t just persist — it widens. Look at the two O-lines slot by slot
TCU is the better unit at four of five spots, and the interior is a rout — Cooper Powers [12.7] and Noah McKinney [12.8] against a UNC middle anchored by a sophomore center in Rowan Byrne [9.3]. That center-vs-interior mismatch is the single biggest lever in the whole game, and heavier trench weighting makes it a fulcrum instead of a footnote. On the other side, TCU’s front already had the pressure-rate edge, so weighting the trenches up compounds the same advantage on both sides of the ball.
Net effect of the trench weighting alone: TCU’s projected margin grows by roughly a field goal, and the game gets more run-heavy and lower-variance — fewer possessions, more clock bleed, exactly the profile that favors the team winning up front.
Now pull Edwards
With Edwards Jr. [14.3] out, Carolina goes to Miles O’Neill [11.5] — that’s a three-point drop in overall grade at the game’s most important position, and a much steeper one in the buckets that matter against pressure. O’Neill has never been a full-time starter, and you’re asking him to debut behind a line that’s already losing the interior against a front that gets home. That’s the worst possible combination: a downgraded, inexperienced passer + a compromised pocket + a pass rush that our model now weights up. Pressure turns clean-pocket QBs into turnover machines, and it’s brutal on a backup making his first start.
Stacking both changes:
Revised Final: TCU 34, North Carolina 13
Revised key player projections
TCU — Horned Frogs (more volume on the ground with the trench edge weighted up)
RB Jeremy Payne [14.4] — 24 car, 138 yds, 2 TD; 2 rec, 15 yds
QB Jaden Craig [13.9] — 18/27, 224 yds, 2 TD, 0 INT; 5 car, 28 yds
WR Jordan Dwyer [13.6] — 6 rec, 88 yds, 1 TD
TE Lafayette Kaiuway [13.5] — 4 rec, 46 yds, 1 TD
North Carolina — Tar Heels (O’Neill starting, pocket under duress)
QB Miles O’Neill [11.5] — 19/35, 176 yds, 1 TD, 2 INT, 4 car, 12 yds
TE Jelani Thurman [14.9] — 6 rec, 64 yds, 1 TD
RB Demon June [12.7] — 12 car, 48 yds
WR Jordan Shipp [14.1] — 5 rec, 58 yds
Notice Thurman [14.9] stays productive — a backup QB under pressure leans even harder on his highest-graded, quickest-read target, so the checkdown/seam volume to the tight end actually holds up. It’s the downfield passing game and the ground game that crater.
Revised game script
1st quarter — TCU comes out committed to the run and it works immediately behind the interior. Payne moves the chains, and a methodical opening drive ends in a touchdown. O’Neill’s first series as the starter is jittery — the TCU front collapses the pocket on 3rd down and forces a punt. TCU 7, UNC 0.
2nd quarter — Carolina’s best stretch. Thurman bails O’Neill out on a couple of quick throws and the Heels stitch together a scoring drive to a field goal. But TCU answers with the trench edge — Payne again, then Craig off play-action to Dwyer for six. Right before half, O’Neill is pressured into a bad throw and TCU takes it the other way for points off the turnover. TCU 20, UNC 3 at the half.
3rd quarter — Game control. TCU shortens it, leans on Payne, and the O’Neill-led offense can’t sustain anything as the pass rush teases every dropback. A Kaiuway red-zone score off play-action makes it a four-possession game. TCU 27, UNC 3.
4th quarter — Garbage-time cosmetics. Thurman hauls in a red-zone touchdown against soft coverage to get Carolina on the board with a real score, but a second O’Neill interception on a pressured throw ends the comeback talk before it starts. TCU adds a closing touchdown on the ground. Final: TCU 34, UNC 13.
My take: the two changes you asked for aren’t independent — they compound. Heavier trench weighting already tilts this toward TCU; removing Edwards removes the one thing that could’ve offset a bad night in the pocket — an experienced, 14.3-graded QB getting the ball out fast. Put a first-time starter behind a line losing the interior, against a front our model now respects more, and you get a two-score projection stretching to three. The number I’d stake it on: O’Neill’s turnover count. If he protects the ball and Petrino schemes him quick throws to Thurman, this stays a two-score game. If TCU’s interior lives in the backfield the way our grades say it should, 34-13 might be generous to Carolina.
Want me to test the other direction — how much of Edwards’ value the model gives back if UNC leans fully into a quick-game, get-it-out-in-under-2.5-seconds plan to neutralize the rush?
ANOTHER EDIT NEEDED: As pointed out by ‘@TexasCRE on X — this game is being played in Dublin, Ireland.
CORRECTED PROMPT: I put “at TCU,” but this game is being played in Dublin, Ireland. Neutral site. Please run again. Going forward, please double check the location before running any simulations!
Alright — sim's re-run for Dublin, neutral field, Billy Edwards Jr. [14.3] out (that bracket is our proprietary overall grade, built from many data factors and scaled to 20), and trench play dialed up 25% in the weighting. Here's what changes and where it lands. I will make a note to double-check all game locations going forward.
The QB swap is the whole ballgame. With Edwards down, UNC goes to Miles O'Neill [11.5] as QB1 — a near three-point drop in our grade at the game's most important position. Freshman Travis Burgess [10.0] is the emergency break-glass option behind him. That's a meaningful downgrade to the Heels' passing floor, and it lets TCU's secondary sit on shorter, safer route concepts.
Weighting the trenches +25% tilts it further toward TCU. The Frogs are the more physical, more veteran outfit up front on both sides — and when you make the line of scrimmage count for more, you're rewarding exactly where TCU already had the edge. It compounds the QB loss rather than offsetting it.
Adjusted neutral-site simulation — North Carolina vs. TCU (Dublin, Aug 29, 2026)
Projected final: TCU 31, North Carolina 20 — an 11-point swing, up from the field-goal margin when Edwards was in. Losing your QB1 and taxing the trenches heavier is a double hit on the same team.
Projected game script:
Early: TCU establishes the run behind the interior edge and controls tempo. Expect a methodical opening drive for points — they want O'Neill throwing to catch up, not managing a lead.
Second quarter: UNC's offense stalls in the intermediate game without Edwards' arm; a couple of three-and-outs let TCU stretch it to two scores by the half. Think 17–6, 20–10 range at the break.
Third quarter: This is UNC's window — if the defense forces a turnover or two and the run game keeps them on schedule, they can claw back to one possession. My model gives them a live pulse here.
Fourth quarter: TCU's front closes it out. With the trench weighting cranked, they salt the clock on the ground, force O'Neill into obvious passing downs, and pull away late. Garbage-time UNC score narrows the final.
The variable that matters most: how quickly O'Neill settles. If he plays to his grade, 11-point Frogs is fair. If he presses early against that TCU front and turns it over, this can get to three scores in a hurry.
Hopefully, this article explains what CFBAI is and how you can use it for anything your football-loving heart desires. Go ahead and try it out. It’s right there on the front page at cfbdepth.com — sign up for extra usage and dominate 2026.